Find where a specific object was allocated in JavaScript with DevTools
Here's a trick to reveal a debugger value in the memory profiler.
Maybe you’re debugging a network request, but the stack trace has been laundered away by a batching mechanism. Maybe you have an enormous React codebase with kilometers of prop drilling, and you can’t be bothered to hit Go To References all morning. In any case, sometimes you just wish you could see where that specific object in the debugger was created.
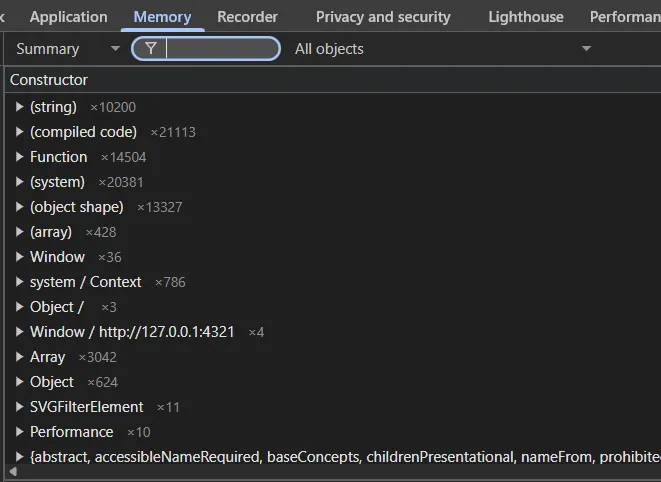
As you may know, the Chrome DevTools’ memory profiler has a mode named Allocations on timeline, which will happily show you where all of the objects were allocated, as long as something holds a reference to those objects when the profiling ends. Often, the object gets cleaned up and you miss it. Even if you catch the object, it’s tricky to find that specific object when all you can filter by is the allocation time, which you don’t know, and the name of its constructor, which is often just object, as is the case for a million other values.
The trick
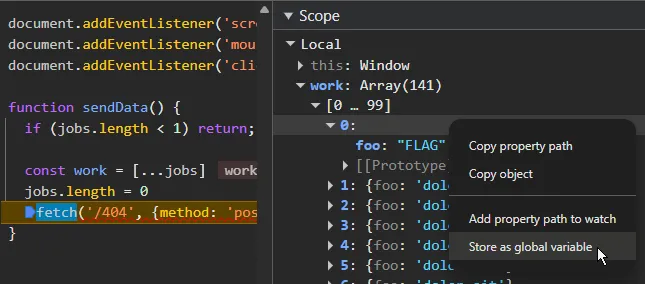
Here’s the trick. In the Memory tab, start profiling with Allocations on timeline with Allocation stack traces ticked. Then in the Sources tab, set your breakpoint and get the debugger to pause wherever you can get that specific object in scope. While paused in the debugger, purposefully leak the object by right-clicking on it in the Scope pane and choosing Store as global variable.
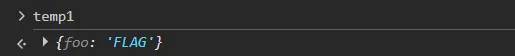
Now, let’s make the value discoverable. In the console, run
temp2 = new class AAAAAAAA { a = temp1 }to allocate a new global object which references the value you’re interested in. The class and variable names aren’t important, what’s key here is that we create an instance of a class with a name we can easily filter by (e.g. AAAAAAAA).
Remove or disable the breakpoint, and continue script execution. Then, stop profiling in the Memory tab. There, Filter by class to search for the class name:
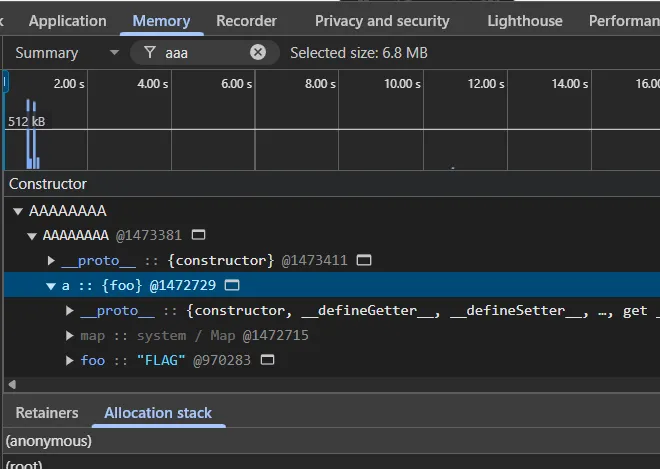
and there’s that specific object with a stack trace of where it was created.